|
Getting your Trinity Audio player ready...
|

Sidekiq is an awesome workhorse for efficiently running background jobs. Whether it be sending emails, processing huge amount of data etc… Maybe that is why for many of us, background processing in ruby ( rails ) is synonymous with sidekiq. All thanks to is efficient use of memory and concurrency model. Here at Rently, we make use of it extensively and currently process around 100k jobs everyday and as we are scaling, the number of jobs are increasing day by day we are keep on adding more and more jobs.
Traditionally, our approach was to create different queues based on job priority and assign a fixed number of workers to each queue. This strategy worked well for us for a long time, ensuring jobs were processed in an orderly fashion. However, a feature request from one of our Product Owners (POs) forced us to reevaluate our approach to managing Sidekiq workers.
We had a feature request from one of our POs which forced us to rethink the way we approach how we maintain our sidekiq workers
The Feature That Sparked Change
The feature request was deceptively simple: some of our clients wanted to watermark their name onto property images displayed on our listing page. But the devil was in the details. Let’s break it down.
For a rough estimation imagine that on average each user has around 100 properties and each property has 30 images. So there are 3000 images to process per user. If we are processing images in a batch of 20 and one batch takes 1 mins to complete.
number of batches = 3000 images / 20 = 150 batches

total time taken to process watermark for one user
150 batches * 1 min = 150 mins = 2.5 hours 😱
This meant that if a user requested the watermark feature, they would have to endure a 2.5-hour wait for the entire process to finish. Clearly, this was far from an ideal user experience, and we needed to find a solution.

How can we solve this.
Sidekiq’s Concurrency Model
Before diving into the world of autoscaling Sidekiq workers, it’s essential to have a grasp of what makes Sidekiq such a powerful workhorse for background job processing. One of its key strengths lies in its concurrency model.
- Job: In the context of Sidekiq, a job represents a unit of work that needs to be performed asynchronously. For instance, sending an email, processing an image, or executing any background task. Each job is enqueued into a specific queue for later processing.
- Process: A Sidekiq process is a separate Ruby process that runs independently. It is responsible for dequeuing jobs from one or more queues and processing them. A typical Sidekiq application runs multiple processes to achieve concurrency.
- Threads: Within each Sidekiq process, there are multiple threads. These threads are responsible for performing the actual job processing. While Sidekiq uses threads, it does not rely on Ruby’s native threads (which can be heavy). Instead, it uses a lightweight, fiber-based approach, which makes it highly efficient in terms of memory usage.
If you are setting the sidekiq concurrency to 5 per thread and you are having 5 processes. The total number of workers are going to be 5 * 5 = 25. That means, it can process 25 jobs in parallel at any given moment.
With all these context set lets jump into the inserting part now
More Workers, Yeah!
There is even simpler solution for this, just add more workers. So it gets processed faster. If you double the number of workers, it get finished twice as fast. So In the above example each worker will be responsible for handling 75 batches each. So we have cut down our time to 1 hour 15 mins.
What if we added even more workers? 10? 20? In our case, adding 25 workers brought the processing time down to just 6 minutes. Now that’s an acceptable turnaround time.
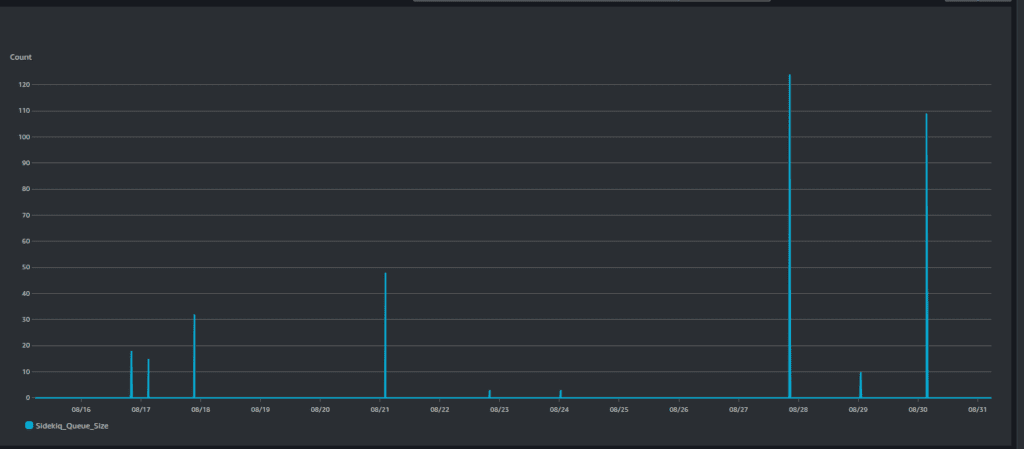
The spikes in the image above represent the Sidekiq queue size. As you can see, most of the time, there are no jobs to be processed. At this point, we’re essentially wasting our resources, with workers sitting idle and doing nothing.This inefficient resource utilization raises questions about the cost-effectiveness and scalability of this approach.
So what if we could spin up workers on demand, when required. wouldn’t that be great.
Auto scaling Sidekiq Workers
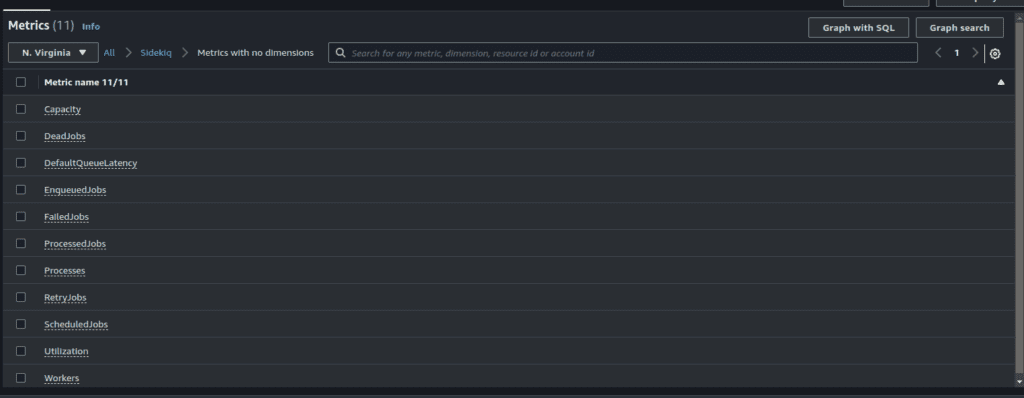
In order to dynamically adjust the number of workers as workload increases and decreases, we must rely on observable metrics to guide us. Fortunately, Sidekiq arms us with not one, but two invaluable metrics for precisely this purpose.
- Latency: Latency, in the context of Sidekiq, refers to the time it takes for a job to be picked up from the queue and actually processed by a worker. Lower latency indicates that jobs are being processed quickly. High latency, on the other hand, means that jobs are waiting in the queue for an extended period before being picked up. This can be a concern when you want your background jobs to execute promptly.
- Queue Size: The queue size represents the number of jobs waiting in a specific queue to be processed. Monitoring the queue size is crucial because it gives you insights into how many jobs are pending and whether your workers are keeping up with the workload. A rapidly growing queue might indicate that you need to scale your workers to handle the increasing load.
Now, from this point onwards, I'll be delving into an AWS-specific approach, as that's what we use at Rently for our infrastructure. But the concepts are similar and can be implemented in other clouds as well
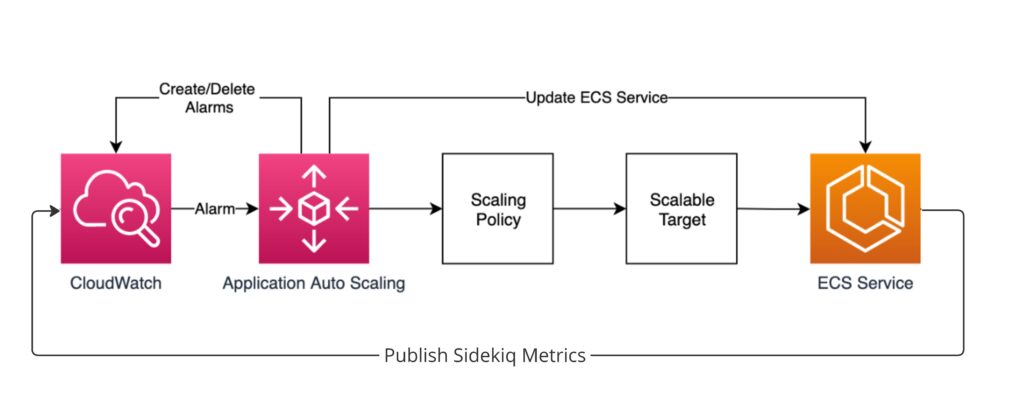
As we provision our containers on AWS on ECS, we need a method by which we can publish the sidekiq’s metrics from inside our containers to cloudwatch so we can make some actionable insights from it. For that there is this very small gem sidekiq-cloudwatchmetrics its only a very few lines and its basically publish the sidekiq metrics to the cloudwatch every 60 seconds.
Now we can use these metrics to do autoscaling when the demand is high.
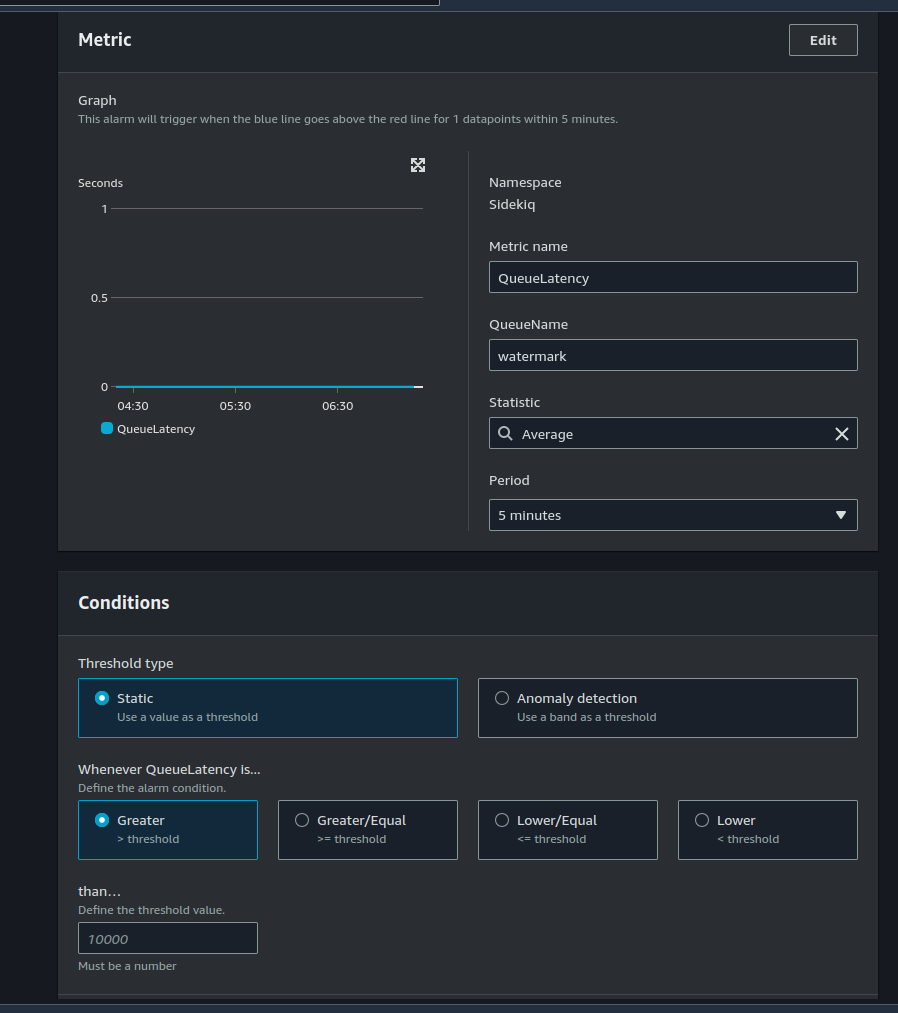
Setting up Cloudwatch Alarm
We are having two specific metrics on a queue to watch for latency and size , so which metrics you should be depending onto do auto scaling ?
As everything in IT the answer is “it depends”, but the general rule you can consider the below points before deciding to go either way.
Queue Latency:
- Use Case: Opt for queue latency-based autoscaling when your main concern is minimizing the time it takes to process jobs. If you have jobs with varying processing times or need to ensure low job execution times, queue latency is a crucial metric.
- Benefits: Queue latency helps ensure that jobs are processed promptly, reducing user wait times. Autoscaling based on this metric can help maintain a responsive system.
- Considerations: Be aware that queue latency may fluctuate due to external factors or variations in job complexity. It’s essential to set appropriate thresholds and avoid excessive scaling, as it may lead to resource wastage during periods of low workload.
Queue Size:
- Use Case: Opt for queue size-based autoscaling when your primary concern is resource optimization and cost management. This metric helps you allocate resources efficiently based on the volume of pending jobs.
- Benefits: Queue size-based autoscaling ensures that you allocate resources based on the actual demand. It can help reduce costs during periods of low activity and allocate resources quickly during spikes.
- Considerations: Queue size may not directly correlate with job execution times. If jobs have varying processing times, autoscaling based solely on queue size might not guarantee optimal job completion times. Additionally, scaling decisions based solely on queue size may result in resource allocation that is reactive rather than proactive.
Here i am opting for Queue Latency , as it makes more sense for this particular use case.
Setting up Autocscaling policy
Once we have setup the alarm we can use it to autoscale based on it
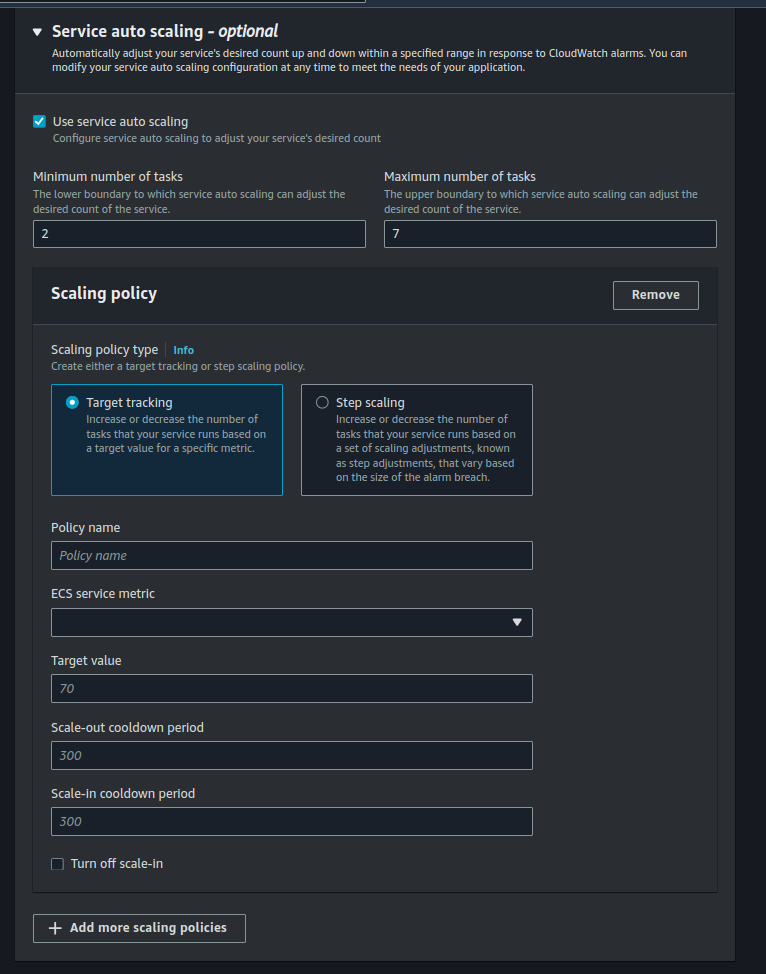
There are two ways you can autoscale your services, target scaling and step scaling.
Target Tracking Scaling allows you to set a target value for a specific metric, such as CPU utilization or memory usage. ECS will automatically adjust the desired count of tasks or containers to maintain the specified metric at or near the target value. While Step Scaling allows you to define a set of scaling adjustments (steps) based on a metric, such as CPU utilization or custom CloudWatch alarms. Each step specifies how many tasks or containers to add or remove when the metric crosses a predefined threshold. Step Scaling is useful when you want fine-grained control over scaling actions, allowing you to specify exactly how many tasks or containers to adjust at different thresholds.
No matter which scaling policy you use, it important that you set sensible values for the minumum and maximum number of tasks or you will be ending up paying more money than you anticipated as it might lead to an runway scenario.
One thing that most people overlook is the, scale-out and scale-in period.
Scale In Time:
- Definition: Scale in time refers to the time it takes to remove resources or downscale your infrastructure in response to reduced demand or the completion of tasks. This process typically involves terminating instances, stopping containers, or deallocating resources.
- Importance: Scale in time is crucial for cost optimization. When your system experiences lower traffic or workload, scaling in efficiently and promptly can reduce unnecessary resource usage and associated costs.
Scale Out Time:
- Definition: Scale out time refers to the time it takes to add resources or upscale your infrastructure in response to increased demand or the need for additional capacity. This process usually involves provisioning new instances, containers, or resources.
- Importance: Scale out time is crucial for maintaining system performance and availability during traffic spikes or increased workloads. Reducing this time helps ensure your system can handle sudden surges in demand effectively.
Results
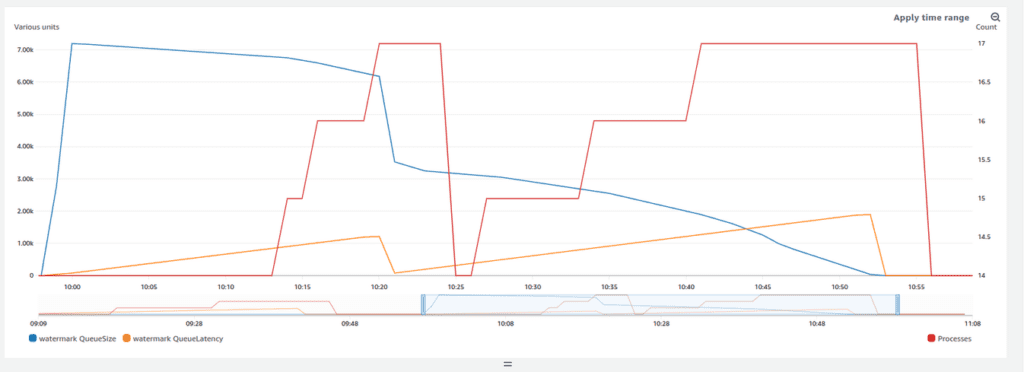
Here you can see that, the number of processes started increasing once a certain threshold for latency has been hit and it continually started provisioning more and more containers as the latency increased in steps of 1.
More reading
- https://engineering.gusto.com/scaling-sidekiq-at-gusto/
- https://docs.aws.amazon.com/autoscaling/ec2/userguide/as-scaling-simple-step.html

Senior software Engineer at Rently Architecture
small amend to the article to clear a caveate with sidekiq’s concurrency model
While Sidekiq does permit its threads to operate parallely, it’s essential to recognize that any limitations imposed by the underlying runtime environment will affect Sidekiq. In the case of multiple threads in JRuby, true parallel execution is achievable, with all threads running in parallel. However, in CRuby, due to the Global Interpreter Lock (GIL), concurrency is the operative term, not parallelism.
Particularly in use cases like fetching images from remote sources, where I/O operations are prevalent, even concurrent execution helps. The ability to handle multiple tasks concurrently, albeit not in true parallelism, can notably enhance the overall responsiveness.
If your goal is to achieve true parallelism and maximize the utilization of multiple CPU cores, it’s often more effective to opt for multiple processes rather than solely increasing the number of threads within a single process